
Asia | China | Economics & Growth

Asia | China | Economics & Growth
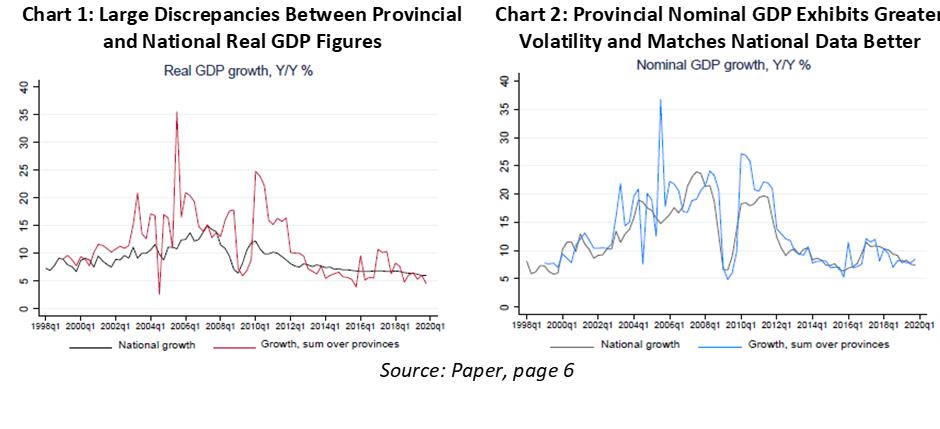
For decades, many have questioned the accuracy and authenticity of Chinese official GDP figures. And a period of abnormally smooth and consistent growth in line with the decade-long real GDP target set in 2012 has only strengthened these concerns (Chart 1). Also, real GDP figures lost all normal fluctuations, complicating any analysis. But a recent BIS working paper exploits provincial macroeconomic data to reveal new insights into Chinese GDP growth. They find:
The model is updated quarterly and is published by the Bank of Finland.
The BIS paper is not the first to consider alternative measures of Chinese growth. We explored how to track China growth using commodity and bond prices. Other attempts include the Federal Reserve’s China Cyclical Activity Tracker (C-CAT), Chinese imports derived from other countries’ export data, energy consumption, business sentiment indicators, and satellite-recorded night-time lights.
Currently, China’s National Bureau of Statistics (NBS) compiles its national accounts according to the United Nations’ System of National Accounts (SNA). One of the key statistics it reports is the country’s real GDP. Prior to 2019, this was calculated by deflating the nominal growth rates reported by provincial statistics bureaus.
Provincial data provided by local bureaus is broadly beyond the control of the NBS and can be much more informative than national figures. The BIS paper exploits this to create an alternative measure of economic activity in China, examining macroeconomic data from 31 Chinese provinces from 1999 onwards. In particular, they include nominal GDP growth which, unlike real GDP, exhibits more volatility. In addition, nominal GDP growth aggregated across provinces matches national growth data to a high degree (Chart 2). It has also been subject to revisions, unlike real GDP.
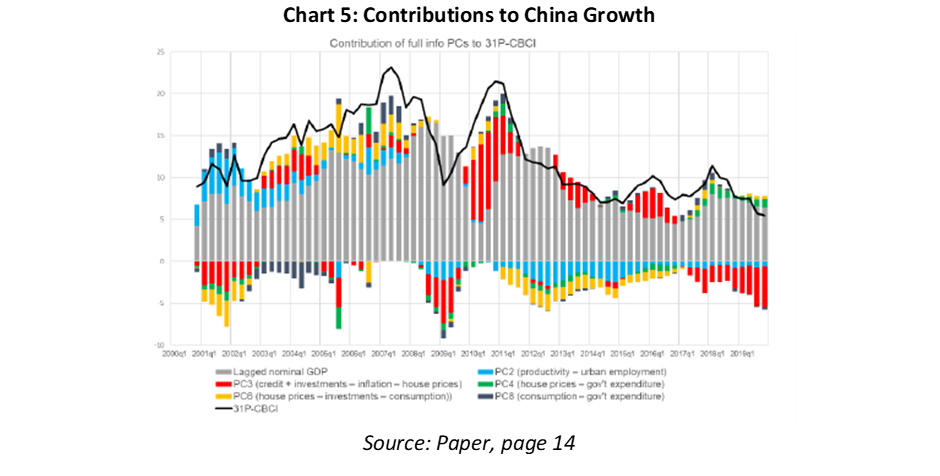
The authors use provincial macroeconomic data calculated at a quarterly frequency. It is compiled from the CEIC China Premium Database, which collates data from different sources. In total, there are 11 variables (Table 1) which span 31 provinces.
The analysis has three parts. The first is a panel regression covering the full set of 11 variables across all regions. For the second and third, the authors use Principal Component Analysis (PCA) to elicit only the most relevant information from each variable. In part two, they compress each economic variable across provinces into their first principal components. For example, that component which explains CPI inflation across provinces best. This component is referred to as the ‘variable specific principal component’. In part three, they compress the full provincial panel (all economic variables for all provinces) into the first eight principal components. They refer to these components as the ‘full information principal components’.
The authors find that a full panel, which includes all the variables in Table 1, can explain 61% of the variance in China’s nominal GDP. Provincial data on inflation, credit, investments, productivity, house prices and consumption are particularly important when projecting growth.
Better still, the variable specific components and the full information principal components explain 88% and 89% of national nominal GDP’s total variance, respectively. This time, the authors find inflation, credit and investments to be the best variables at projecting future national nominal GDP growth.
In other words, in addition to the alternative methods described above, you could use the following three methods for measuring Chinese growth:
For Model 3, Table 1 shows the factor loadings of the full information principal components that are statistically significant. To aide with interpretation, PC3 has credit and inflation as the main factor loadings. That is, these variables reflect the main variations on that factor. As a result, the authors refer to this factor, or indicator, as ‘credit in real terms’. Similarly, PC2 is ‘productivity in urban areas’, PC6 is ‘deviations of investment from consumption’, and PC8 captures the difference between private consumption and government expenditures (note, the interpretation of PC4 is less clear).
All three models are significantly correlated to official nominal GDP growth, although Model 3 performs best.
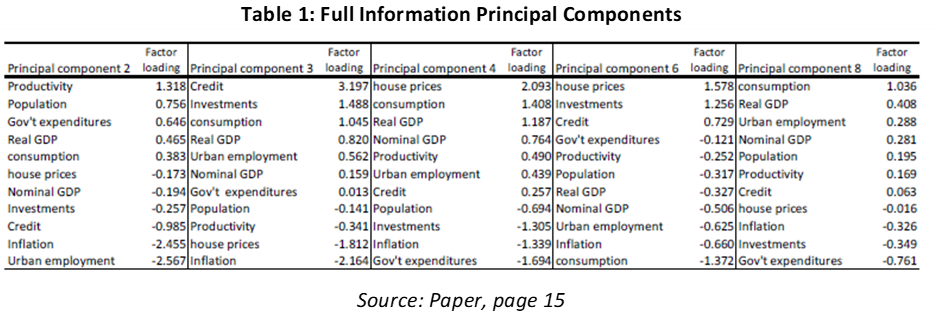
Model 3 explains the highest proportion of variation in official Chinese nominal GDP, and therefore the authors use it as their preferred measure of Chinese growth (Chart 3). They stress, however, that they are more interested in uncovering business cycle fluctuations, which official real GDP data currently hides, than the actual level of growth. Consequently, they standardise the series to have zero mean and unit standard deviation (Chart 4). The model is updated quarterly and is published by the Bank of Finland.
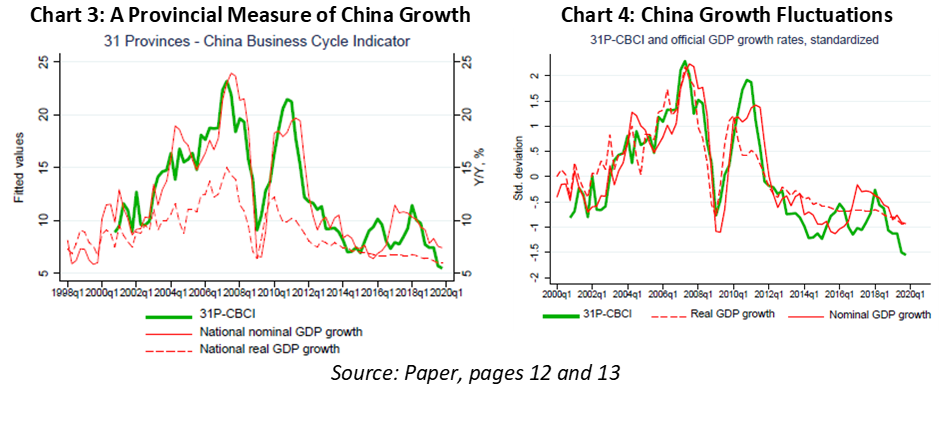
Over the full sample period, credit, investments, house prices and urban productivity has mainly driven Chinese growth. Productivity in urban areas played a greater role at the start of the sample but has since affected growth negatively (Chart 5). Meanwhile, credit in real terms has contributed to growth in a cyclical fashion; it appears to alternate between up- and down-cycles every three years.
Over the last decade, productivity and urbanisation have contributed somewhat less to aggregate growth. Instead, demand has predominantly driven growth, with credit, house prices and public expenditure playing greater roles. Since 2017, deviations of investment from consumption and differences between private consumption and government expenditures have been the main sources of growth.
Unsurprisingly, there exists significant heterogeneity across provinces in terms of growth, cycles and structural changes in China. Running the same full information factor model for all 31 provinces, the authors compute the correlation coefficients between provincial models and future aggregate national growth. Provinces with correlation above the median contribute more significantly to growth (Chart 6).
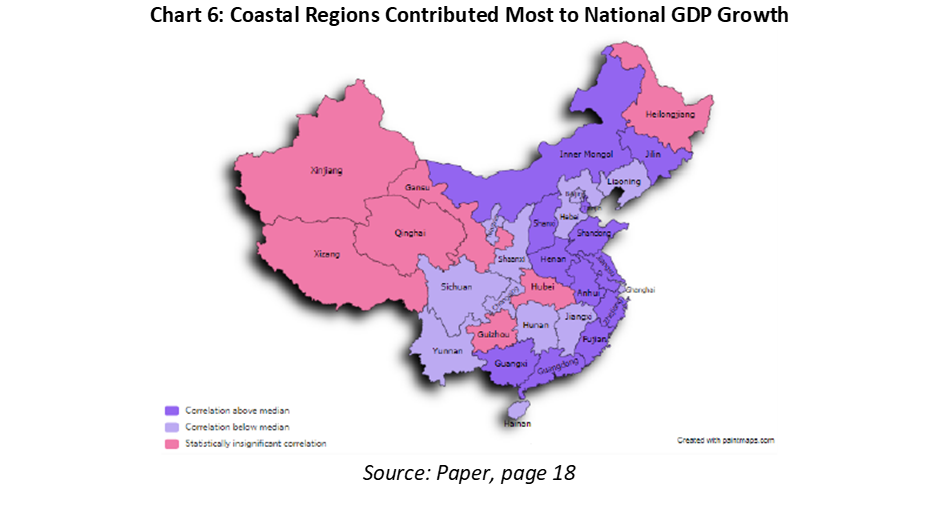
Coastal and central provinces have the strongest correlation to aggregate growth. These regions have relied more on growth through productivity and investment. In recent years, however, growth has become more homogenous across provinces, and the reallocation of labour has become less prominent as a growth driver. This could indicate a greater degree of equality across China.
The BIS paper’s main aim was to build an alternative China growth measure that allows for greater richness than the current official real GDP print. It is built from the bottom up, using macroeconomic variables gathered at a provincial level. It is no surprise that it is highly correlated with nominal GDP because the same data feeds into China’s official growth figures. Indeed, the measure will therefore also suffer from similar reporting issues, limiting how much it can reveal about the true level of economic growth.
Nevertheless, the 31P-CBCI’s value is in providing greater detail on Chinese GDP growth drivers over time and across provinces. On this front, they provide unique insights, confirming that demand has predominantly driven recent growth and that urbanisation is playing a less significant, if not negating, role.
Kerola E., Mojon B., (2021), What 31 provinces reveal about gowth in China, BIS, (925), https://www.bis.org/publ/work925.htm
Spring sale - Prime Membership only £3 for 3 months! Get trade ideas and macro insights now
Your subscription has been successfully canceled.
Discount Applied - Your subscription has now updated with Coupon and from next payment Discount will be applied.