
Summary
- A new NBER working paper analyses the most extensive archive of business texts yet, from The Wall Street Journal, to show how news articles can provide valuable insights into macroeconomic activity.
- They find news attention explains 25% of the variation in aggregate stock market fluctuations, and a spike in recession-related articles can significantly predict changes in output and employment.
- The results show how economic fluctuations can emerge from the news, and the benefits of incorporating text-based data into traditional macroeconomic models.
Introduction
Consumer preferences and news production technologies merge to determine the news we read. That is according to Sendhil Mullainathan and Andrei Shleifer, authors of the popular 2005 paper ‘The Market for News’. If true, articles published in the media should mirror the prevailing economic issues that are important to both consumers and producers.
And so, armed with new machine learning methods, researchers have recently started to test whether the news can provide valuable economic insights when aggregated. A new NBER working paper is the latest in this growing literature. The authors use a topic model to analyse the texts of over 800,000 articles from The Wall Street Journal (WSJ) and ask, can the amount of news attention allocated to a topic explain movements in macroeconomic activity? It can. Their key findings are as follows:
- The volatility of asset returns is linked to the news attention of related topics. For example, the frequency of news associated with oil markets is similar in dynamic to the volatility of crude oil prices.
- Beyond asset prices, data series on output, employment and uncertainty also match the paths of related news topics closely.
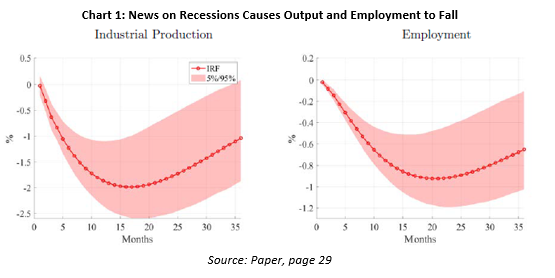
- Accounting for causality, greater news attention to the ‘recession’ topic has economically large and highly significant predictive power for future output and employment (Chart 1).

Topic Models in ML
To study the texts, the authors use the Latent Dirichlet Allocation (LDA) topic modelling approach in its ‘bag-of-words’ form. In essence, a bag of words is a representation of text that describes the occurrence of words within a document. The LDA then seeks a workable thematic summary of those words, thereby making the WSJ text much more digestible and interpretable.
Here is how it works. The method reduces the representation of a text corpus into a smaller set of common ‘topics’ that tend to co-occur in articles. Within these topics are a set of pre-defined key terms, such as quake or tsunami,which would be associated with the ‘natural disasters’ topic. Then, each term within a topic is assigned a probability, and those assigned especially high probabilities govern the topic’s ‘theme’.
This leaves us a taxonomy of themes that are the subjects of attention in financial markets and the broader economy. The authors calculate how much attention each theme gets by summing over all the articles in any given period (e.g., day or month) and determining how frequently terms in those articles are assigned to a topic. For example, how many times oil is added to ‘oil markets’ in January 2017.
Topic models are a popular dimension reduction technique for two reasons. First, they allow for the formation of topics estimated from clusters of terms. Second, they quantify the amount of news attention allocated to each topic by providing estimates of the proportion of text dedicated to each topic in an article (articles can have multiple topics, such as ‘recession’ and ‘macroeconomic data’). Combined, this lets us analyse the interaction between news and economic activity, for example.
The Data and Topics
The authors use all articles published in WSJ from January 1984 through June 2017, purchased from the Dow Jones Historical News Archive. This, they claim, is the most extensive textual body of business news studied in the economics literature to date. They include only the articles under the three core sections – Section One, Marketplace, and Money and Investing. In total, there are 763,887 articles with a vocabulary of 18,432 unique terms.
As described, these unique terms are clustered into 180 topics, which also belong to larger themes. For example, the topic ‘oil markets’ comes under ‘Oil & Mining’ and ‘Economics’. At its broadest level, news is classified into either ‘economy’ topics or ‘politics and culture’ topics. Within ‘economy’, there is ‘financial intermediaries’, ‘economic growth’, and ‘industry’. You can view a graphical representation of the taxonomy here.
Only a few topics are sentimental, such as problems, concerns and positive sentiment. The authors use these as ‘modifier’ topics that, when interacted with other topics, convey the directional appraisal of the event (e.g., problems and oil markets). Some words appear with a higher frequency in many topics, so weights are applied to scale for frequency and downplay words that are common across topics. Get an idea of the keywords attached to each topic here.
News Attention
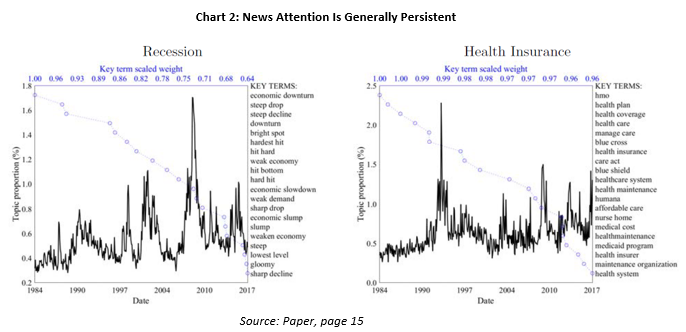
Simply put, news attention is the amount of attention devoted to a topic as a proportion of the total monthly WSJ news production. For example, at the end of 2008, over 1.6% of all WSJ news related to the ‘recession’ topic (Chart 2). You can find the individual charts for all topics here.

Primarily, these charts show news attention is generally persistent. Take ‘recession’ and ‘health insurance’ as an example – both exhibit prolonged waves of high and low attention. A long open question in financial research is why do asset returns exhibit such strong volatility clustering? A leading hypothesis proposes volatility is driven by news arrivals, and that news itself arrives in clusters (Engle et al., 1990). The persistence in news topic attention supports this hypothesis.
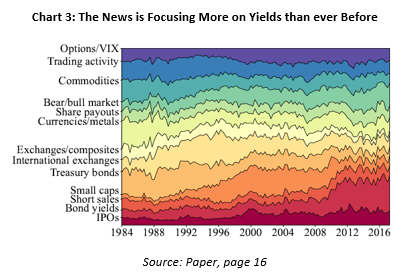
We can also see changes in news attention within themes. In the ‘financial markets’ theme, for example, focus shifts from Treasuries and international markets in the late ’80s and early ’90s to small caps in the dot-com era and bond yields after the GFC (Chart 3).

News and Macroeconomic Variables
Does news attention carry any predictive information on the state of the economy through either aggregate output, employment, stock market returns, or stock market volatility?
It does, and the authors find the ‘recession’ topic most informative. That is, more media content around this topic is negatively correlated to growth, employment and market returns. And greater ‘recession’ attention is positively related to market volatility.
Also, ‘rail/trucking/shipping’ attention is positively related to employment growth, ‘oil market’ attention is negatively correlated with output growth, and ‘problems’ is a positive driver of market volatility.
Overall, the paper finds news attention explains 25% of the variation in the stock market. This shows just how valuable interpretable text-based data is. In the past, the literature has found it notoriously difficult to explain stock market fluctuations with anything other than other asset prices. Here, the authors show news attention can produce a large gain in explaining return variation.
Economic Fluctuations Emerge From News
The results so far say nothing about whether news text helps model longer-term macroeconomic trajectories. They do, however, show the ‘recession’ topic contains valuable information on the state of the economy. So, the authors use a VAR to plot out the response of output and employment to a change in ‘recession’ attention in the news (Chart 1).
They find a positive shock to ‘recession’ news attention generates a 1.99% drop in industrial production after 17 months. Employment declines by 0.92% after 20 months. These effects are highly statistically significant and show strong predictive power.
The authors run the same exercise for news attention and stock market returns. In theory, stock price fluctuations are driven by changing expectations about future macroeconomic outcomes. News also reflects agents’ expectations and, unlike other macroeconomic data, could therefore help predict returns. Indeed, a positive ‘recession’ attention shock is followed by a 7% fall in stock prices after two years. Notably, the news variable ‘recession’ is better at predicting future output changes than the stock market.
So why do economic fluctuations emerge from news? The authors give three reasons. One, business news provides a summary of expectations about future productivity, and so by definition should reflect future economic conditions. Two, if the news captures macroeconomic expectations, and these expectations are inaccurate, it can induce volatility in economic activity. And three, related to ‘animal spirits’, WSJ interviews with influential finance professionals are likely to drive market sentiments. This, in turn, could affect the economy.
Bottom Line
There is a lot to absorb in this paper. I take away from it the importance of text-based analysis for financial and economic researchers. Narrative data is augmenting traditional macroeconomic models and providing unique insights. In this paper, for example, the authors show how economic fluctuations emerge from news – there is a strong prediction that declines in output, employment and stock prices follow spikes in ‘recession’-related news in the media. This highlights the strong connection between news and the real economy.
Citation
Bybee, Kelly, Manela & Xiu (2021) Business News and Business Cycles, NBER, https://www.nber.org/papers/w29344
Sam van de Schootbrugge is a Macro Research Analyst at Macro Hive, currently completing his PhD in international finance. He has a master’s degree in economic research from the University of Cambridge and has worked in research roles for over 3 years in both the public and private sector.
