
Summary
- The VIX shows a well-defined seasonal pattern, falling during H1 then rising in H2 before declining late in the year.
- Closer examination reveals much of the seasonal effect is due to well-known recessions and crises – for example, Covid in 2020, the financial crisis in 2008-09, and the collapse of Long-Term Capital Management in 1998. Excluding those years, the seasonal effect is smaller but still perceptible.
- With the VIX now trading at the lows of the post-pandemic period, investors are clearly not worried about a recession nor anticipating a major crisis.
- Any seasonal bounce in the VIX in Q3 could come from Q2 earnings season, if companies start to dial back the optimistic outlooks many posted during the Q1 earnings season.
Market Implications
- Between the VIX being at cyclical lows and the prospect of less robust outlooks in the coming earnings season, we expect at least a modest seasonal bounce in the VIX and commensurate pressure on equities.
- This is not a call to sell – rather a cautionary note.
Too Good to Be True?
We came across a provocative chart recently showing the daily average of the VIX index of short-dated US equity volatility from 1990 to 2023 (Chart 1). There is a clear seasonal pattern – it gradually declines during H1, bottoms in July, rises through October, then declines in November and December.

You might think this looks too good to be true. One quibble point might be that the seasonal effect does not appear particularly strong. The low point is 18%; the high is 22%. Yet as we know, the VIX can soar to well over 50% during periods of market stress.
Closer inspection reveals several well-known anomalous years account for most of the H2 seasonal effect. Take out 1990 (recession), 1998 (Russian default, Long Term Capital implosion), 2001-02 (9/11 and Worldcom/Enron defaults), 2008-09 (financial crisis) and 2020 (Covid), and the VIX is both lower and the seasonal effect all but gone.
Further, looking at the standard deviation around the daily average VIX reveals quite a few years where the VIX exhibits no seasonality statistically (Chart 3). You can see this in Chart 4. (The dark and light blue lines are 2020 and 2008, respectively).

Still…There Is Something
Nevertheless, there is still a small H2 seasonal effect even excluding the various recession and crisis years.
One factor that could help explain that seasonal effect – and that could be relevant this year – is Q2 earnings season. At the halfway point, companies have a better idea of how the year is going as reflected in their year-to-date earnings and outlooks. We do not have data on historical earnings or outlook surprises by quarters, but we know anecdotally that Q2 can be a source of surprises.
Looking ahead, at this point we (and markets) see little risk of either a recession or major blowup in coming quarters. The VIX is now trading near 13% – the lowest point since 2019 (Chart 1).
If there is a seasonal bump in the VIX in Q3, it could be little more than a bounce off a cyclical low.
The upcoming earnings season could also be an issue. Q1 earnings were exceptional in terms of beats – after several quarters of eking out beats of around 2%, the companies in the major indices posted average beats in the 6-7% range. That, of course, was largely due to low expectations, but an economy that continued to bubble along at full employment even as the Fed pushed its policy rate up to 5% was also a factor.
Equities Respond to VIX
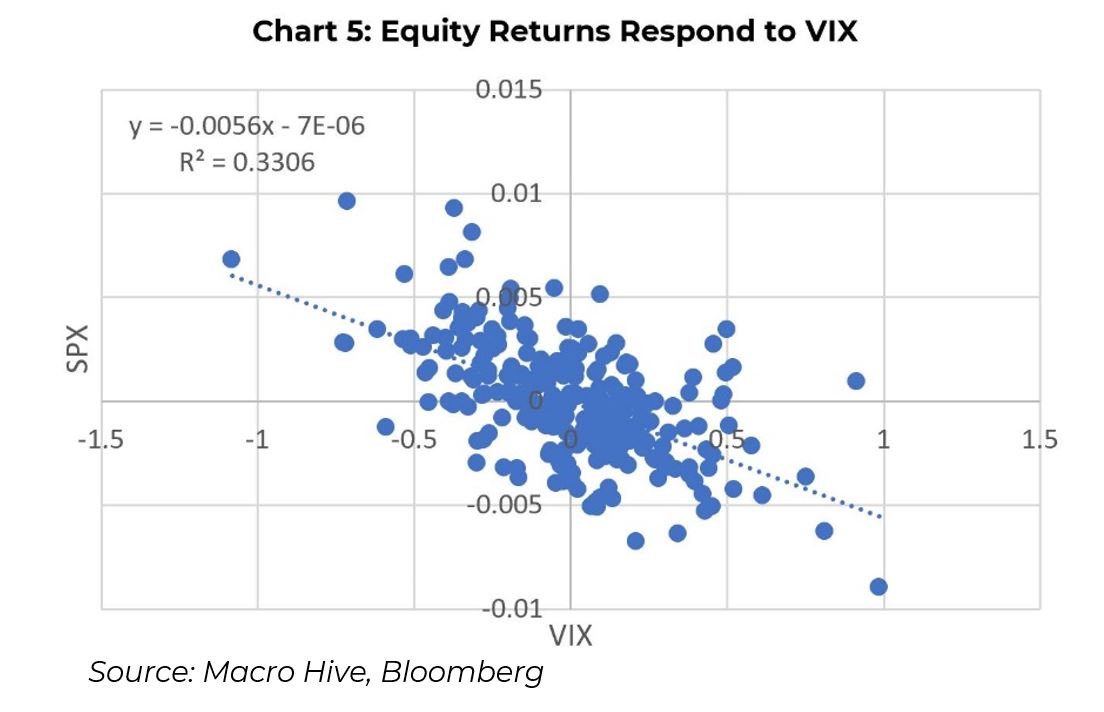
We care about the VIX because it affects equity prices – at least in the short run. When the VIX rises, equities usually sell off or at least turn more cautious (Chart 5). Here we plot daily change in our average daily VIX versus average daily SPX return. Over longer timeframes, this relationship is less reliable – over any stretch of time, the primary driver of equities will always be earnings.

That said, if we see a pickup in the VIX, we can reasonably expect equities to sell off, especially given the more stretched valuations after the rally of the past few months.
Over a 30-year career as a sell side analyst, John covered the structured finance and credit markets before serving as a corporate market strategist. In recent years, he has moved into a global strategist role.
Photo Credit: depositphotos.com
