
Summary
- Following the BoE decision to keep the base rate at 5.25%, the rates market has re-priced lower.
- I argue further dovish re-pricing is still likely because the labour market is looser than headline unemployment shows, and house price declines will weigh on household consumption.
- Consequently, wage growth may correct notably lower, inflation may fall faster, and the probability of UK recession may increase.
- If so, sterling will keep underperforming, short-term yields will come under pressure, and FTSE100 will outperform both global peers and the more domestically focused FTSE250.
A Dovish Awakening
Thursday’s Bank of England (BoE) decision to keep rates at 5.25% was a ‘dovish awakening’ to the market, with the statement covering recent (dovish) developments extensively. The market is now pricing about 15bps of additional hikes and roughly 20bps of cuts between January and August 2024.
I previously argued sterling weakness has legs as the economy is deteriorating and the BoE will re-price lower. I see clear risks that rates re-price lower still. If so, GBP weakness will run further, while the FX-sensitive FTSE100 should outperform the broader market.
UK Labour Market Looser Than Headline Unemployment Implies
The UK unemployment rate (UR) has risen from 3.5% (August 2022) to 4.3%. While this suggests the UK labour market is loosening, UR is an incomplete measure of market tightness because it excludes the economy’s demand side.
Strictly, labour market tightness is defined as the number of job vacancies (or openings) per unemployed individual (V/U).
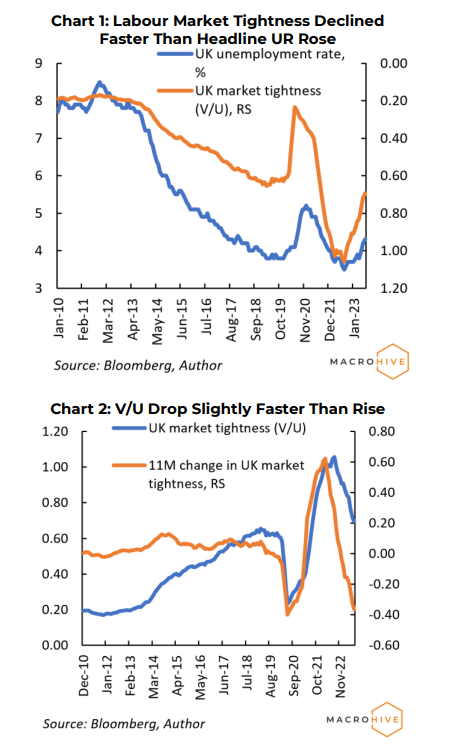
In the UK, the V/U ratio stands at 0.69 (July 2023), having declined from a peak of 1.06 (August 2022). More specifically:
- The V/U ratio has declined faster than the headline UR has risen. That is, labour market tightness has cooled faster than most believe. This is because job vacancies have fallen as the UR rose.
- The drop in vacancies per unemployed individual has declined by 0.36 (jobs) over 11 months (from the peak); this is a steeper decline than the previous 11-month rise (September 2021 to August 2022).
Loose Labour Market Risks Downside Pressure on Wage Growth
The BoE’s latest statement alluded to the decline in the V/U ratio. The implication/risk of such a rapid adjustment in market tightness is that wage growth could start falling faster than expected, exerting further pressure on inflation.
The relationship between private pay growth and the V/U ratio since 2010 (see Appendix for technical details) reveals:
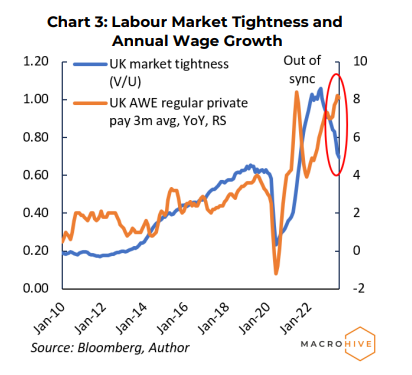
- Annual private wage growth is much higher (about 4ppts) than labour market tightness can justify. Although this could be due to economic reopening momentum and/or accumulated excess savings (higher savings increase workers’ ‘threat point’ in wage bargaining), economies are normalizing. Consequently, wage growth must decelerate.
- Market tightness will very likely fall further, putting additional pressure on wage growth.
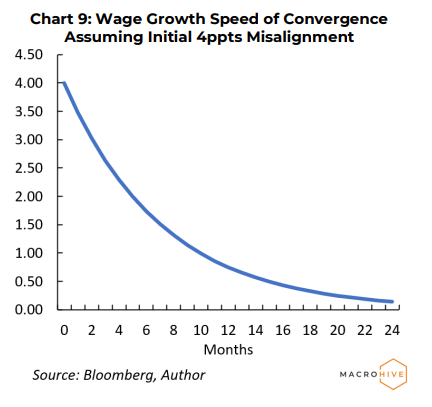
- The historic relationship implies that a 4ppts wage growth ‘overshoot’ would take an average of around two years to correct. However, the abnormal post-pandemic period suggests a faster correction – akin to 2021 when a discrepancy of 5.6ppts (wage growth higher than market tightness) took only 4-5 months to correct.
House Price Correction Risks Severe Contraction
House prices are currently contracting at 5.3% per year (Nationwide). And the RICS house survey for price expectations (next 12M) implies things will worsen before they improve.
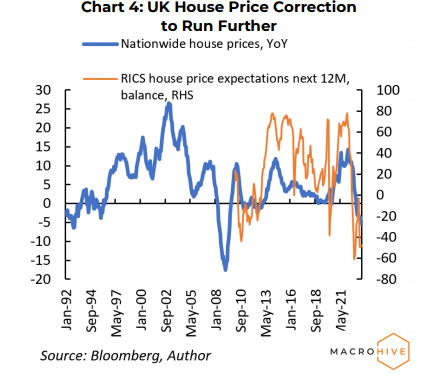
The issue here is twofold: (i) UK households are significantly exposed to house prices; (ii) unlike the US, mortgages are mostly tied to short-term rates.
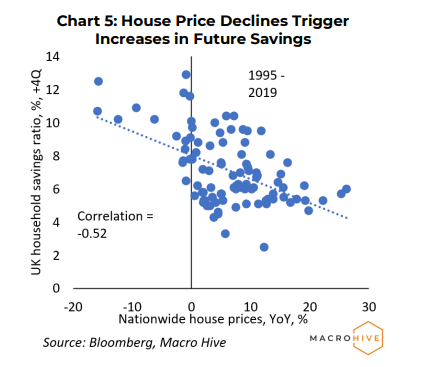
Unsurprisingly, house price growth and future savings (over +4Q) have a tight historical link. Plummeting house prices risk triggering a rise in the household savings ratio, leading to consumption curtailment, potentially faster inflation declines and increased recession risks. If so, the BoE will be highly unlikely to keep the base rate near 5%.
Market Implications
It seems far too many forces are working in tandem for the BoE to keep monetary policy very restrictive for long:
- An increasingly loose labour market, pointing to wage growth declines.
- A severe house price correction.
- Subdued activity, with the UK composite PMI underperforming the US and EZ.
If these risks materialize, the market implications would be:
- UK short-end yields will face more pressure. The UK2Y yield should fall to 4% over the next 3-6 months. In rates spreads, paying the Jan-24 vs receiving the Aug-24 contracts also makes sense.
- Sterling should keep underperforming. I look for GBPUSD to drop to 1.20-1.15, EURGBP to approach 0.90, and sterling to face renewed weakness vs oil-linked FX such as NOK and CAD. Specifically, GBPNOK could revisit 1.12 in the next 3-6 months, and GBCAD could fall to 1.55.
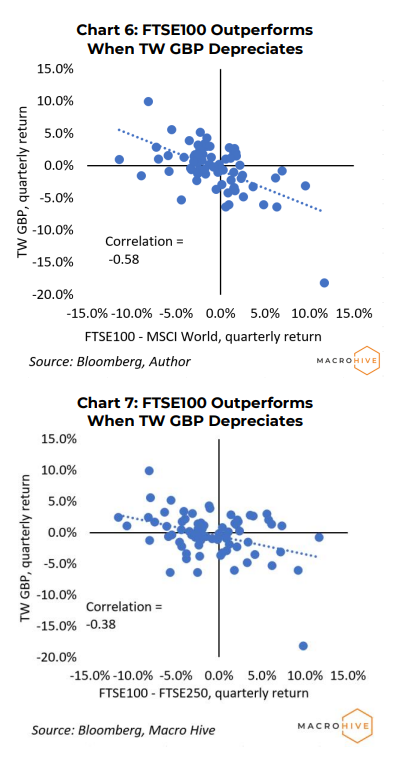
- FTSE100 should outperform. Sterling weakness combined with a potential further re-pricing lower in UK rates would likely see the FTSE100 outperform global/developed equities and the more domestically focused FTSE250.
Appendix
We can test and estimate the long-run relationship between market tightness and wage growth using a cointegration/ Error Correction model (ECM).
This boils down to (a) estimating the relationship between the two i.e. regressing wage growth on market tightness; (b) testing for residual stationarity, which ensures that there is a long-run stable relationship between the two; and (c) using an ECM to look whether wage growth adjusts to past discrepancies from ‘equilibrium’ wage growth.
For the first step, I use monthly data from January 2010 to December 2019; the pandemic and post-pandemic periods have been quite abnormal so are excluded (though results do not change materially if included). The model I am estimating is:
Regular private pay YoY (t) = c + b * Market tightness (t)
The estimate of b (call it b_hat) is equal to 4.14 (intuitively positive) and statistically significant at better than 1% level of significance; R-squared is around 0.66, meaning that UK market tightness explains about two-thirds of the variation in annual private wage growth.
The second step involves calculating the residuals and testing for stationarity. To compute the residuals, one needs to take the difference between actual wage growth and implied wage growth i.e.:
Residuals (t) = Regular private pay YoY (t) – Regular private pay YoY_hat (t)
where Regular private pay YoY_hat (t) = c_hat + b_hat * Market tightness (t)
The residuals are shown in Chart 8 and stationarity can be established for the period 2010-2019; however, since 2020 it is obvious that fluctuations have been unusually large. One could argue that these large misalignments are evidence that the relationship between wage growth and market tightness has broken down. I do not believe that: COVID, lockdown policies initially and the re-opening that followed, together with the accumulation of excess savings, have had a major impact but should not alter the long-run relationships, especially as excess savings are being depleted and monetary policy tightening keeps inflation expectations from de-anchoring. Effectively, I am treating this period as a short-term anomaly and assume that it reasserts itself as the economy normalizes.

The third step is estimating the following ECM:
Δ (Regular private pay YoY) (t) = a + d * Δ (Market tightness) (t) + g * Residuals (t-1)
Δ denotes the one-period change. What is of interest here is the estimate of g (call it g_hat): if its value is negative and statistically significant, then the ECM “works” in the sense that e.g. positive past deviations lead to wage growth declines, so that the latter converges to its implied level. The higher the absolute value of g_hat, the faster this convergence will be.
For the period 2010-2019, g_hat = -0.13 and statistically significant at better than 1% level of significance. Its magnitude suggests that a 4ppts deviation of actual pay growth from implied will disappear in about 2 years via wage growth decreases – all else equal.
