

Over the past week, bitcoin (BTC) registered new all-time highs of almost $67,000 – over 3% higher than the previous high in April (Chart 1). Sentiment towards bitcoin was very positive in the immediate aftermath of the surge: a recent Macro Hive poll found most expect it to reach $100,000 in this current rally. The highly anticipated SEC approval of the first US regulated bitcoin futures ETF drove the push through the previous high. The ProShares ETF had a blockbuster debut, topping $1 billion in trading volume on its first day. The market has since corrected, hitting weekly lows of almost $58,200. So you may be asking, should I buy bitcoin now?
A day after registering all-time highs, the US arm of crypto exchange Binance suffered a flash crash. This wiped almost 90% from the bitcoin price, cascading onto other crypto exchanges too but in much smaller magnitude. According to a Binance US spokesperson the crash was caused by a bug an institutional traders trading algorithm that has since been resolved. Prices recovered quickly; however, this is likely still being factored into the recent correction. As Binance CEO Changpeng Zhao tweeted, ‘Expect very high volatility in crypto over the next few months’.
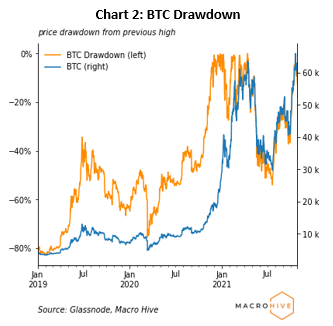
To gauge how far the current correction could go, we can look at bitcoin’s price drawdown from previous highs. In 2019, the largest drawdown was 83%, in 2020 it was 75%, and in 2021 so far it has been 53%, which occurred in July after the previous all-time high registered four months earlier in April (Chart 2). So, maximum drawdowns have decreased each year since 2019. Were the current correction to draw down the same as the maximum since the previous high (53%), this would send bitcoin prices to around $31,400. But most of our metrics continue to give a bullish signal, so we would expect any corrections to be shallow.
Here’s run-down of the metrics:

(1) Institutional Demand: Neutral Bitcoin
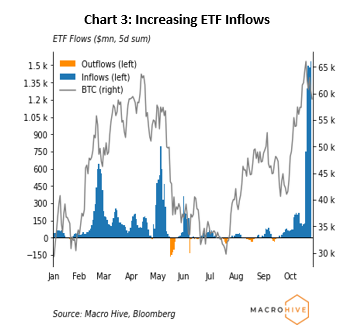
Our preferred method to track institutional demand is flows into bitcoin ETFs (Appendix). Flows have been positive over the past month (Chart 3). Over the past week, ETF inflows posted their biggest week on record with around $1.5 billion flowing into bitcoin ETFs. And around $1.2 billion came from the newly approved ProShares Bitcoin Strategy ETF alone (Chart 3). Notably, previous spikes in inflows seem to correspond with price peaks.
We also monitor news around bitcoin and whether evidence exists of bitcoin entering the mainstream. On that front, the news has been positive. Interactive Brokers, one of the largest electronic trading platforms in the US, has launched ethereum and bitcoin trading for registered investment advisors (RIAs) in the US. Three bitcoin ETFs gained approval in the last week, including Valkyrie Funds, which became the first asset manager to list a bitcoin futures ETF on the Nasdaq exchange. Lastly, the communications director for Grayscale, Jennifer Rosenthal, confirmed the firm will be applying to convert their flagship Grayscale Bitcoin Trust (GBTC) into a spot ETF.
So, the news is positive, but past ETF flow spikes coinciding with price peaks, gives us a neutral signal from the institutional side.
(2) Demand for Liquidity and Exchange Activity: Bullish Bitcoin
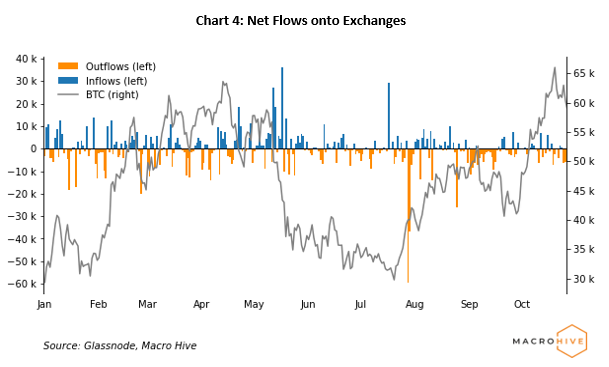
A measure of bitcoin bullishness is whether investors prefer to hold it in illiquid form (e.g., in a private wallet) or liquid form (e.g., on an exchange). Increased flows onto exchanges can signal bearishness – it suggests investors want to hold ethereum in a liquid form. Conversely, increased outflows can signal bullishness as investors are happy to hold onto their coins.
During the May selloff, flows onto exchanges spiked (Chart 4), implying bearishness. Month to date, the distribution of flows has been balanced, with 50% of days seeing outflows and 50% of days seeing inflows. More recently, there has been a bias for outflows, with a net value of 17,399 coins flowing out of exchanges over the last seven days. This is bullish bitcoin.
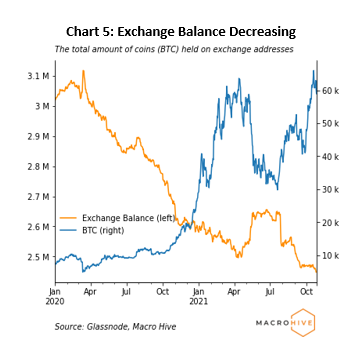
The overall exchange balance (the total number of bitcoins held on exchange addresses) has maintained a downtrend since July (Chart 5). Currently, around 13% of the bitcoin supply is held on exchange addresses (down 5% year to date), the lowest level since around February 2018. Outflows from exchanges naturally lead to the exchange balance decreasing, so this is also a bullish sign for the market as investors hold in anticipation of further price rallies. On the other hand, with renewed institutional interest in bitcoin, as more supply is drained, institutional investors/whales may face supply shocks.
(3) Futures Activity: Bullish Bitcoin
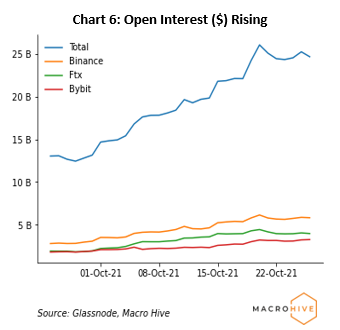
We track the growing market of bitcoin futures. Open interest – the sum of long and short contracts – is a good measure of investor interest. Throughout September, the total open interest fell on news of the China crackdown on crypto activity. However, from October, open interest has resumed an uptrend and is currently up 44% month to date (Chart 6).
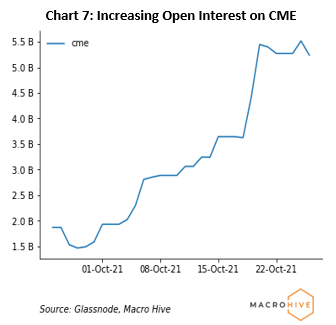
In particular, the picture on the CME exchange is very positive. The underlying for the ProShares BTC futures ETF is the CME bitcoin futures contract, which catapulted open interest on the CME up 219% month to date to all-time highs of $5.51bn on Monday (Chart 7). Together, these suggest strong support for bitcoin.
(4) HODLer Dynamics: Bullish Bitcoin
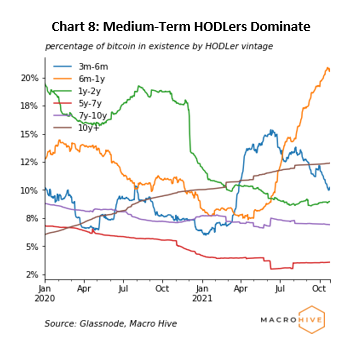
‘HODLing’ refers to buy-and-hold strategies in the context of bitcoin and other cryptocurrencies (Appendix). We categorise HODLers by the length of time they have held bitcoin. Short-term HODLers (3m-6m) have been decreasing – down 13% month to date, whilst medium-term HODLers (6m-1y) have been increasing – up 8% month to date (Chart 8), suggesting a portion of short-term HODLers are converting to medium-term HODLers. Currently, medium-term HODLers dominate 21% of all bitcoin in existence.
Some of the longer-term vintages have also been increasing gradually throughout October. The 1y-2y, 5y-7y, and 10y+ vintages are up 1.6%, 1.5%, and 0.7% month to date, respectively. However, the 7y-10y vintage is down 0.8% month to date, likely due to long-term HODLers selling to realise a profit at the new highs and some transitioning into 10y+ HODLers. Overall, we view these HODLer dynamics as bullish for bitcoin.
(5) Investor Profit and Loss: Neutral Bitcoin
An attractive feature of public blockchains and crypto markets is that we can track each transaction more easily. One measure of transactions is spent outputs – that is, some computing output is spent to enable a transaction. The spent output can tell us when a transaction has occurred, by whom and at what price. This allows us to track the profit and loss (P&L) of investors. We can then use this data to calculate three P&L-related measures: percent supply in profit (PSIP), net unrealised profit and loss (NPUL) and the spent output profit ratio (SOPR). (The Appendix details each.)
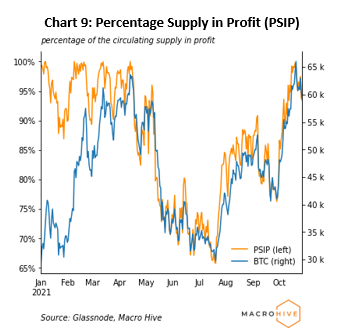
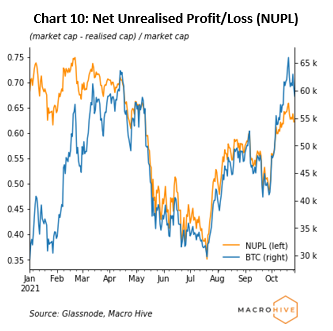
The share of supply in profit (PSIP) is currently 94%, up approximately 18pp from September lows, but down 5pp from the all-time high registered on 20 October due to the correction (Chart 9). The size of the unrealised profits (NUPL) is currently 62% of market cap, up 14pp from September lows, but down 4pp week on week (Chart 10). Realised profits are healthy with a SOPR value above one (Chart 11). Through the bitcoin rally to new all-time highs, SOPR moved sideways, suggesting investors are reluctant to realise profits yet with the belief that the price will continue to increase. To some extent, the bitcoin rally would naturally lead to these ratios improving; factoring in the subsequent correction, we view them as neutral/bullish for bitcoin.

(6) Mining Activity: Bullish Bitcoin
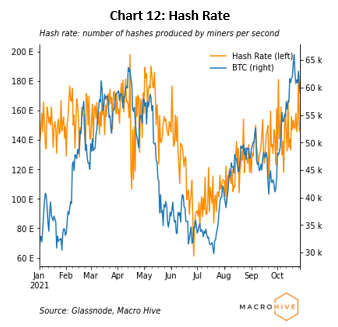
We track the hash rate for bitcoin. A higher rate means more computing power is available to maintain the network, deliver more security (resistance to attacks), and facilitate more transactions. We view this as a bullish sign (Appendix). Conversely, we view a falling hash rate as bearish. The hash rate bottomed in late June following the China crackdown but has resumed an uptrend since (Chart 12). It is currently up 10% month to date, 6% year to date, and 138% since bottoming out in June. This is bullish bitcoin.
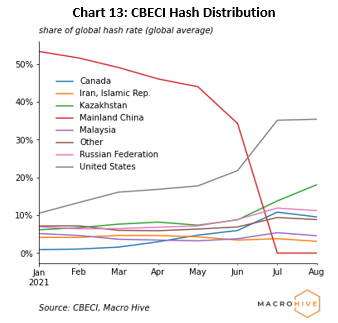
We can also track the geographical distribution of the total hash rate over time using the Cambridge Bitcoin Electricity Consumption Index (CBECI). The index is the result of an extensive effort by the Digital Assets Programme Team at the Cambridge Centre for Alternative Finance. According to the latest numbers, as of August, BTC miners in the US now dominate, with approximately 35.4% of the global hash rate distribution (Chart 13). This likely reflects significant mining activity from the East migrating to the West after the China crackdowns on crypto.
Bottom Line
We have introduced a framework for understanding the flow and microstructure dynamics of BTC markets. The key metrics are:
- Institutional demand: SEC approval of a bitcoin futures ETF causing huge inflows. Neutral bitcoin.
- Liquidity demand: less flows onto exchanges and exchange supply decreasing. Bullish bitcoin.
- Futures activity: open interest increasing because of ETF approval. Bullish bitcoin.
- HODLer behaviour: short-term HODLers converting to medium-term HODLers, and long-term HODLers gradually increasing. Bullish bitcoin.
- P&L of investors: realised and unrealised profits still strong but decreasing following the correction from bitcoin all-time highs. Neutral bitcoin.
- Mining activity: hash rate increasing. Bullish bitcoin.
On balance, the metrics are giving a bullish signal for bitcoin.
Appendix
Institutional Demand
Perhaps the largest institutional vehicle for bitcoin is the Grayscale Bitcoin Trust, with over $27bn in assets. It invests solely in bitcoin, and so many investors, notably institutional, who cannot hold bitcoin directly can get exposure through investing in Grayscale. Consequently, if the trust trades at a premium to bitcoin prices, it may imply ‘excess’ demand from institutions, but ‘excess’ supply if it trades at a discount. Alternatively, investors may be using other vehicles to get exposure such as ETFs or holding bitcoin directly. We put more weight on ETF flows than the Grayscale premium.
Liquidity Demand
Another measure of cryptocurrency bullishness is whether investors are willing to hold it in illiquid form (e.g., a private wallet) or prefer a liquid form (e.g., on an exchange). The former would suggest investors are bullish, as they are comfortable with being unable to sell easily. Conversely, holding it in liquid form would suggest investors are bearish, as they prefer being able to sell easily.
Therefore, large flows onto crypto exchanges would suggest investors want to convert their holdings to a more liquid form, possibly implying more bearishness.
HODLers
In our introductory bitcoin flow framework, we explained ‘HODLers’ and ‘HODLing’. HODLing refers to buy-and-hold strategies in the context of bitcoin and other cryptocurrencies. Those who HODL for long periods are die-hard adherents.
We can categorise HODLers by the length of time they have held BTC. We define long-term or staunch HODLers as those who bought BTC five or more years ago and have held it ever since, medium-term HODLers as those who bought 6-12 months ago, and short-term HODLers as those who bought 3-6 months ago. We can break this down further into those who have held bitcoin from the very early days (7-10 years ago and 10+ years ago).
Profit and Loss
- The percent supply in profit (PSIP). This tracks the share of circulating BTC supply in profit. That is the percentage of circulating BTC whose current price is higher than when it was last transacted (movement).
- Net unrealized profit and loss (NUPL). This is the ratio of unrealised profits over total market capitalisation. While PSIP just focuses on whether BTC coins are in profit or not, the NUPL focuses on the size of profits. So, we could have a situation where the PSIP is low – that is, a low share of supply is in profit – but the NUPL could be high if the size of those profits is very large.
- Spent output profit ratio (SOPR). While PSIP and NUPL focus on unrealised profits or mark-to-market, this measure focuses on realised profits. SOPR is the realised value of a transaction divided by the value at initiation (or creation) – more simply, price sold divided by price paid. If SOPR is above one, investors in aggregate have realised profits, while below one means they have realised losses. In broad uptrends, SOPR spends a significant amount of time above one, whereas the opposite is true for broad downtrends.
When SOPR is rising, sellers are increasingly realising profits. The opposite is true when it is falling. A price rally with a flatter SOPR trend indicates investors are not yet realising their profits with the rally. The reluctance of investors to sell and realise a profit may be because they believe the price will increase further, which would be bullish. At the same time, more profit taking could precede a correction. Typically, buying BTC as SOPR moves around one during bullish periods has proven to be a profitable strategy.
Mining Activity
Computing power is central to the crypto market. Miners use advanced computing hardware to solve complex problems that confirm BTC (and other coin) transactions on the public ledger or blockchain. The miners are rewarded with new coins for their efforts. A measure of the complexity of the problems and so the computing performance required to solve them is the hash rate. The higher this rate, the more computing performance is needed to maintain the blockchain. The rate can fluctuate depending on demand for crypto.
Dalvir Mandara is a Quantitative Researcher at Macro Hive. Dalvir has a BSc Mathematics and Computer Science and an MSc Mathematical Finance both from the University of Birmingham. His areas of interest are in the applications of machine learning, deep learning and alternative data for predictive modelling of financial markets.
Bilal Hafeez is the CEO and Editor of Macro Hive. He spent over twenty years doing research at big banks – JPMorgan, Deutsche Bank, and Nomura, where he had various “Global Head” roles and did FX, rates and cross-markets research.
