
Summary
- A Man Group paper examines the real return performances of various assets and trading strategies during high-inflation periods.
- It finds commodities and collectables offer positive real returns, while bonds, equities and residential real estate tend to perform poorly.
- To capture positive real returns, consider using cross-sectional and time-series momentum strategies – they generally yield higher returns during inflationary periods than non-inflationary ones.
Trading and Inflation – How to Profit in Hard Times
In a recent Deep Dive, we reviewed the performance of equities during periods of high inflation. It showed they have been a poor hedge historically. But, more recently, there are signs real stock returns have become much less sensitive to inflation as the policy rate has tended to zero. With inflation expected to remain high in 2022, what are the best stock trading strategies in this environment?
To find out, I review a paper from Man Group published on SSRN at the start of the summer. It examines the performances of various assets during high-inflation periods and highlights the trading strategies that deliver the highest returns. The main results are as follows:
- Nominal bonds see weak returns (unsurprising given rising inflation is typically associated with rising yields). Moreover, real returns to credit are negative.
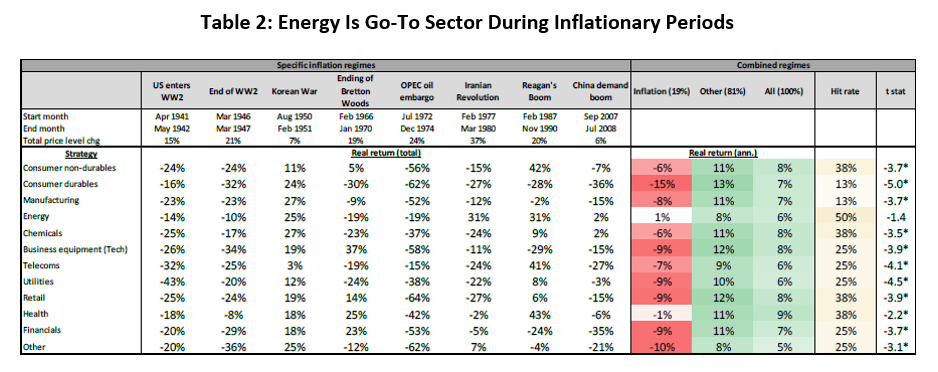
- Equities also perform poorly, compounding the challenge for a 60:40 equity-bond investor. Even the energy sector is only slightly better than flat in real terms.
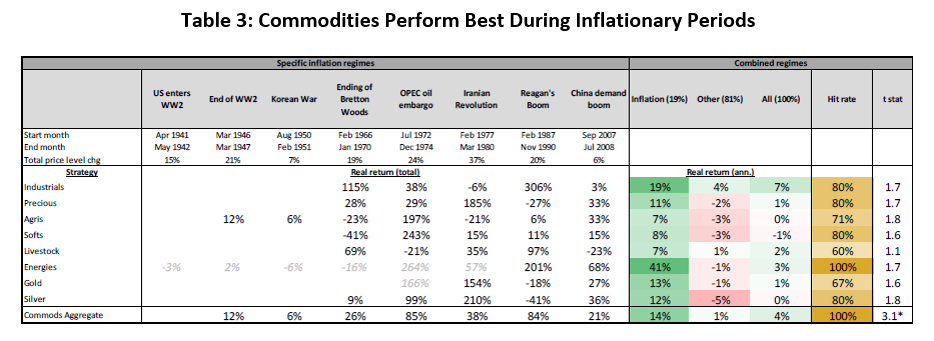
- Meanwhile, commodities outperform in periods of high and rising inflation, averaging +14% annualized real returns since 1926.
- Lastly, time-series momentum strategies applied to liquid futures and forwards across assets perform well during inflation regimes, especially with bonds and commodity trends.
Inflation and Asset Prices
A well-studied link exists between inflation and equity returns. In short, greater uncertainty, tax implications, future economic weakness and changes in risk premiums generally lead to a negative correlation between stock returns and inflation. However, this tends only to be so when inflation is long-lived. Temporary inflation, meanwhile, only has minimal impacts on asset prices.
Bond prices, which reflect an expected real interest rate, expected inflation rate, and a risk premium, usually fall in high-inflation environments. Bonds with higher durations will be more sensitive than those with shorter durations. And any uncertainty about inflation rates may also impact the risk premium and further affect yields. Commodities can be a leading cause of inflation and generally offer protection from its effects.
How to Define Inflation Periods
The authors define inflationary periods as when YoY headline inflation is above 5% for six months, during which inflation does not fall below 50% of its maximum annual rate in a rolling 24-month window. Accordingly, the authors’ inflation calculation gives eight inflationary periods in the US since 1926. The authors also run the same inflation calculation for the UK and Japan. Meanwhile, performance is measured as annualized returns in nominal and real terms.
Asset Performance Under Inflation
To start, the authors examine the performance of financial assets during the eight identified inflation regimes, comparing it with non-inflationary periods (Table 1). The ‘hit rate’ gives the proportion of periods for which the asset has yielded a positive return.

Starting with equities, nominal returns average zero, and real returns are negative. This is significantly different from returns in non-inflationary regimes. For the 10-year Treasury bond, the performance during periods of high and rising inflation is also poor. Consequently, the 60:40 equity-bond portfolio yields a -6% annualised return in high-inflation periods.
Despite the overall negative outlook for equities and bonds, the authors divide the inflationary regimes into ones where inflation started from a very low point (below 2.6%) versus ones where inflation was already high. In general, equities perform better when inflation starts low (i.e., when there is a risk of deflation). When it starts to rise from below 1%, equities even appear to benefit from rising inflation.
Broken down by equity sectors, only energy records positive real returns during high-inflation periods (Table 2). In bond markets, longer-dated Treasuries perform worst, while TIPS provide 2% annualized real returns (but this is not better than in non-inflationary periods).

How Do Hard Assets Perform?
Next, the authors consider hard assets: commodities, residential real estate and collectables. They find hard assets nearly always offer positive real returns in high-inflation periods (Table 3), where returns here assume investment in commodity futures (plus a cash return to create a funded investment).

Overall, foodstuffs do worst, generating 7-8% real returns. Meanwhile, energies lead by far at 41%. Gold and silver are in between, with real returns of 12-13%, although silver performs more consistently during high-inflation episodes.
The authors again divide inflationary periods into ones where inflation started from a low point versus ones that started nearer to 5%. Unlike equities, when inflation starts from below 1%, the positive relation between commodities and inflation appears weaker.
For residential real estate, real returns are on average -2% during high-inflation episodes, which is lower than during non-inflationary ones (+2%). The UK real estate experience is like the US, while for Japan, the real return is higher during inflationary regimes than at other times.
Lastly, collectable art, wine and stamps perform better during high-inflation periods. Real annual returns are positive for all three asset groups, with art at +7%, wine at +5%, and stamps at +9%. Such assets are, however, unlikely to be part of most investors’ portfolios.
Trading Strategies During Inflation
The above represents returns from passive investments. But the authors also see how dynamic strategies perform, such as long-short stock factor portfolios and trend strategies. Here, they must account for implementation costs, estimated at 2% and 0.8% per annum for stock factor and future trend strategies respectively.
The authors compare the real returns from the following long-short equity strategies in Table 4. The strategies are: ‘Small Minus Big’ (SMB), based on market cap; ‘High Minus Low’ (HML), which uses the book-to-price ratio; ‘Robust Minus Weak’ (RMW), which orders stocks on EBT margin; ‘Conservative Minus Aggressive’ (CMA), based on the annual change in total assets; and Momentum, based on past 12-month return.
There are two additional factors called ‘Quality Minus Junk’ (QMJ) and ‘Bet Against Beta’ (BAB). The former is a combination of profitability (captured through various profit and margin measures per unit of book value), growth (trailing five-year growth in profits), and safety (market beta, volatility of profits, financial leverage, and credit risk). In the last, beta in the BAB strategy uses the CAPM model.

The best stock trading strategy during high-inflation periods is a cross-sectional momentum strategy, which delivers +8% real returns and a 75% hit rate. Conversely, smaller companies perform poorly in inflationary regimes. In real terms, the premium for being long small size and short large size is -4% a year in inflationary periods, compared with +1% in normal times.
Other stock trading trends also emerge. Quality appears to hold up well during inflationary periods, while beta is weak, with an average annual return of -3%. Profitability and value factors generally hold their own during inflationary periods but perform worse than during non-inflationary periods. Notably, all these dynamic strategies generally have low or even negative betas with the market.
Finally, saving the best till last, the authors construct a time-series momentum (trend) strategy applied to liquid futures and forwards. The strategy has a 10% ex-ante annualised volatility target, and the weights to historical lags in the trend definition is chosen such that it best approximates the BTOP50 trend-following index returns. The results for the different asset classes are below (Table 5).

All five trend strategies yield positive real returns, which are higher than during non-inflationary periods. For bonds and commodities, real returns are positive during each of the individual inflationary regimes, and their overall performance is much higher than FX and equities.
Bottom Line – Trading and Inflation
The paper is short and simple, providing a high-level overview of asset class performances during high-inflation periods. Notably, though, the authors only consider performances during, at most, eight events, so we can say little about causality. Nevertheless, the analysis of trading strategies gives a clear winner: momentum strategies, especially ones following trends in commodities.
Sam van de Schootbrugge is a Macro Research Analyst at Macro Hive, currently completing his PhD in international finance. He has a master’s degree in economic research from the University of Cambridge and has worked in research roles for over 3 years in both the public and private sector.
